Diffusion of chlorides into concrete is the primary cause of corrosion of reinforcing steel (rebar) in bridge decks. Chloride salts on the surface of bridge decks diffuse through the porous concrete until they reach the depth of the reinforcement. When the concentration of chlorides reaches a critical level, active corrosion of the rebar commences.1
The diffusion of chlorides in concrete is a complex process.2 Factors that influence the movement of chlorides include the properties of the concrete, the surface chloride concentrations, and depth of concrete cover over the rebar. Finally, physical deformities in the concrete, such as cracks, significantly accelerate the movement of chlorides through the concrete to the rebar.
One way to mitigate corrosion is to use corrosion-resistant rebar rather than plain black steel. Common choices are fusion-bonded epoxy coated rebar, galvanized steel rebar, and stainless steel (SS) rebar.
For numerical modeling of chloride-induced corrosion, all of these input parameters are random variables with their own statistical distribution.1 Random variables can be modeled as triangular distributions with defined minimum, maximum, and mode (expected) values. Diffusion models that incorporate Monte Carlo calculations are better able to simulate the probabilistic nature of the input variables.
Modeling Parameters
Fick’s second law of diffusion requires four input parameters: (i) surface chloride content, which is influenced by the amount of deicing salt usage; (ii) depth of concrete cover, which is controlled during the construction process; (iii) chloride diffusion constant, which is influenced by the type of concrete, construction methods, and environmental temperature and moisture conditions; and (iv) the chloride corrosion initiation values, which are influenced by the reinforcing steel type and surface conditions. Detailed evaluations of the modeling parameters were presented at NACE CORROSION 2019.3
To achieve a minimum of 75 years of maintenance-free service life, the Virginia Department of Transportation (VDOT) current requirements for steel-reinforced concrete bridge decks are: (i) a concrete cover depth of 63.5 mm (minus zero, plus 12.7 mm); (ii) a low permeable concrete with a maximum water/cement (w/c) ratio = 0.45 and a minimum of 376.5 kg/m3 of cementitious material; (iii) the use of Portland cement plus fly ash or slag; and (iv) the use of corrosion-resistant reinforcing steel.
Probabilistic service life modeling techniques were used to estimate and compare the chloride-induced corrosion resistance of steel-reinforced concrete bridge decks exposed to salt loading within the Commonwealth of Virginia, including service life costs associated with maintaining bridge decks for a period of at least 75 years.
Modeling parameters, such as chloride loading, were obtained directly from VDOT, while the depth of concrete cover and chloride concentration distributions were measured directly from core samples obtained in 2005 from bridges representative of the construction era of 1984 to 1991.4
Monte Carlo probability modeling based on Fick’s second law of diffusion was used, incorporating bridge surface crack densities of 0, 3, 6, and 12%, and three types of reinforcing steel: epoxy coated (ECR), hot dip galvanized (GS), and Type 316LN SS (UNS S31653).
Surface Chlorides
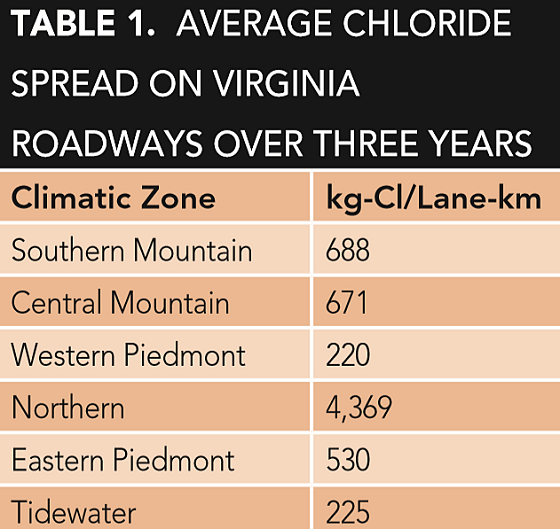
The Commonwealth of Virginia is composed of six climate zones.5 Table 1 presents the average chloride spread per lanemile in each of the six climatic zones. The six different climatic zones in Virginia can be represented by three zones: Northern (4,369 kg-Cl/lane-km), Southern Mountain (688 kg-Cl/lane-km), and Tidewater (225 kg-Cl/lane-km), which were studied in detail. Surface chloride values representing these three climatic zones were compiled from a Virginia bridge deck study that included 27 bridge decks built between 1984 and 1991, using a maximum w/c = 0.45.4
Depth of Concrete Cover
In the study, 75 different depths of concrete cover were used.
Chloride Diffusion Constant
Core samples were used to determine chloride diffusion constants for both uncracked and cracked surface conditions. For uncracked cores, the distribution of chloride concentrations as a function of depth was analyzed by fitting a one-dimensional solution of Fick’s second law of diffusion to determine the effective diffusion coefficient over the period that the deck had been in service.4
For cracked cores, it was found that not all of the bridge deck surface cracks extend to the depth of the reinforcing steel, and there is no relationship between surface crack width and depth.4 Chloride samples were taken directly over the surface crack and followed the crack throughout its depth. Analysis showed the chloride ingress at surface cracks followed Fick’s second law of diffusion. The surface crack diffusion constant data set was shown to be statistically greater than the non-cracked condition.4 To account for the area influence of a surface crack, the length of the crack is multiplied by an influence length perpendicular and on each side of the crack by 50 mm.
Corrosion Initiation and Propagation
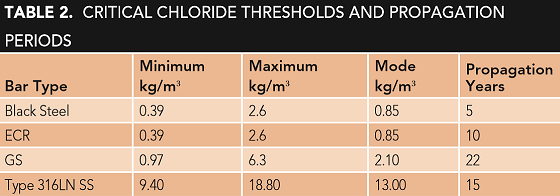
Chloride-induced corrosion of reinforcing steel is a two-step process of corrosion initiation followed by propagation. The critical chloride thresholds for corrosion initiation have been shown to cover a range of values that are different for each type of reinforcement.6 The time period from corrosion initiation until the cracking and spalling of the concrete is referred to as the corrosion propagation period. An extensive literature survey was used to determine the values for the three types of rebar used in this study.3 Table 2 summarizes the critical chloride thresholds and the corrosion propagation periods used in this study, for plain steel, ECR, GS, and SS rebar.
Modeling Results
The time period for corrosion initiation is the time required for the chloride concentration to exceed the threshold on 2% of the bridge deck reinforcing steel. The 2% level is the upper limit of the diffusion prediction limit.5 The total corrosion propagation time is the time required for corrosion to advance from 2% of the steel to 12%. The level of 12% represents the end of functional service life (EFSL) of the concrete.7 This damage level is defined as the sum of the patched, spalled, and delaminated areas of the concrete.
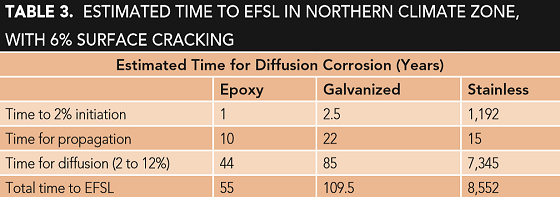
Based on these criteria, service life results are shown in Table 3 for the initial condition of 6% surface cracking of the deck surface area for the most severe climate zone, the Northern zone. Deck deterioration is the sum total of the corrosion initiation plus the corrosion propagation time period. Table 3 shows the EFSL for ECR and GS service life are 55 and 109.5 years, respectively. The service life of SS is far in excess of 100 years. For all conditions modeled in this study, climatic zone and initial surface cracking, the estimated maintenance-free time periods and time to EFSL for GS rebar are significantly greater than for ECR.
Cost Analysis
The lifecycle cost analyses were performed for each climatic zone and initial starting condition. The life cycle cost analysis (LCCA) calculation used followed the present worth methodology as defined in the U.S. Department of Transportation Primer.8 The cost of repairs follows VDOT guidelines for type B patching and new rigid overlays.9
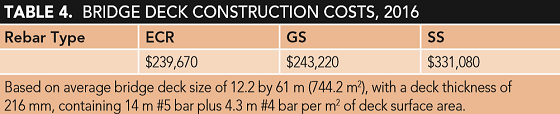
The construction costs determined in this study are presented in Table 4 and are for the year 2016. For price determined in years other than 2016, the USDOT/FHWA National Highway Construction Cost Index was used to bring the price forward to 2016.
Lifecycle Cost Analysis and Total Present Cost
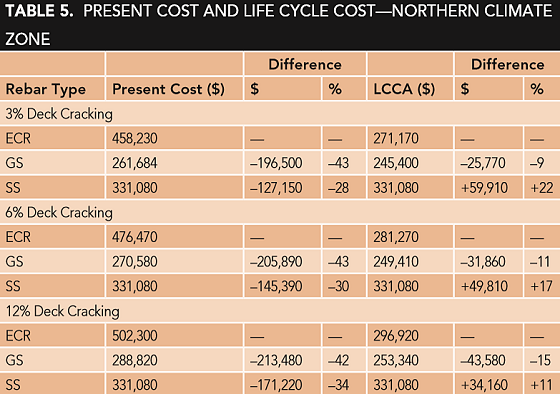
For the VDOT criteria studied for a 744.2-m2 bridge deck with low permeable concrete, a design depth of cover of 63.5 mm, and measured chloride surface concentrations in the state, Table 5 shows that the hot-dipped galvanized reinforcing steel has the lowest present cost and lowest lifecycle cost for all combinations of deck cracking condition in the most extreme environment of the Northern climate zone.
In fact, this was true for all three environmental climate zones studied: Northern, Southern Mountain, and Tidewater. The GS performs better than ECR in all combinations of surface conditions in these three climactic regions. As well, the cost difference between ECR and GS increases significantly as chloride exposure increases in each climactic zone. The difference in present cost between ECR and GS increases by a factor of over eight times from the Tidewater to the Northern zone. This trend is expected to hold at even higher chloride levels than used in this study, which may be typical of states with higher salt-dosing rates. The cost difference between GS and SS, meanwhile, varies only slightly between climactic zones, by ~5% over the three zones.
Conclusions
For the study criteria of low permeable bridge deck concrete, design cover depth of 63.5 mm, and the chloride exposures for the different climactic zones in the Commonwealth of Virginia, the following conclusions are drawn:
• The probability-based chloride diffusion model demonstrates the influence of bridge deck surface cracking conditions and chloride exposure conditions on service life.
• Comparing ECR, GS, and SS rebar, the galvanized steel has the lowest lifecycle cost and total present cost for a 100-year design life.
• GS performs better than ECR in all combinations of climactic and surface conditions.
• The cost of ECR compared to GS increases as chloride exposure increases.
• The service life of GS-reinforced decks is shown to be over 100 years.
Acknowledgment
The International Zinc Association gratefully acknowledges the numerical modeling work of Professor Richard Weyers of Virginia Tech to determine and analyze the total cost of ownership for bridges in a wide variety of climates that use deicing salts, based on his extensive history of work on the subject in the Commonwealth of Virginia.
References
1 G.S. Williamson, et al., “Validation of Probability-Based Chloride-Induced Corrosion Service-Life Model,” Materials J. 105, 4 (2008): pp. 375-380.
2 R.E. Weyers, D.W. Mokarem, “Selecting Chloride Corrosion Distribution for Service Life,” Materials J., under review (2016).
3 M. Gagné, et al., “Modeling Corrosion Resistance of Reinforced Concrete Structures,” CORROSION 2019, paper no. 12873 (Houston, TX: NACE International, 2019).
4 S.S.G. Balakumaran, R.E. Weyers, M.C. Brown, “Linear Cracking in Concrete Bridge Decks,” Virginia Transportation Research Council, VTRC 18-R13, March 2018.
5 G. Williamson, “Service Life Modeling of Virginia Bridge Decks” (Ph.D. dissertation, Virginia Polytechnic Institute and State University, 2007).
6 M.C. Alonso, M. Sanchez, “Analysis of Variability of Chloride Threshold Values in the Literature,” Mater. Corros. 60, 8 (2009): pp. 631-637.
7 R.E. Weyers, et al., “Concrete Bridge Protection and Rehabilitation: Chemical and Physical Techniques. Service Life Estimates,” Strategic Highway Research Program, National Research Council, SHRP-S-668, July 1994.
8 “Life-Cycle Cost Analysis Primer,” Office of Asset Management, U.S. Department of Transportation, Federal Highway Administration, FHWA IF-02-047, August 2002, p. 25.
9 “Part 2: Life Cycle Cost Analysis Guidelines— Chapter 32, Maintenance and Repair,” in Manual of the Structure and Bridge Division, Virginia Department of Transportation, 3206-3, February 2012.