Large Gain Seen in Average Annual Salaries Reported for the United Kingdom; United States Reports Smaller Gain
For corrosion professionals in the United States and United Kingdom, the results of this year’s annual corrosion career and salary survey sponsored by Materials Performance (MP) magazine are very positive. The average annual U.S. salary for 2017, as determined by salaries reported by participating U.S. members of NACE International, rose again this year to reach a new high. This continues an upward trend that started in 2005. The most notable change, based on responses from NACE’s U.K. members, is seen for the United Kingdom’s average annual salary, which increased more than 11% to reach its highest level since this group was added to the MP corrosion career survey in 2014.
The 2017 average annual salaries calculated for Canada, and European countries using the Euro, are somewhat lower than last year’s. Canada’s average annual salary fell to a level near the one seen in 2015 and the European average annual salary was closer to the one reported in 2014.
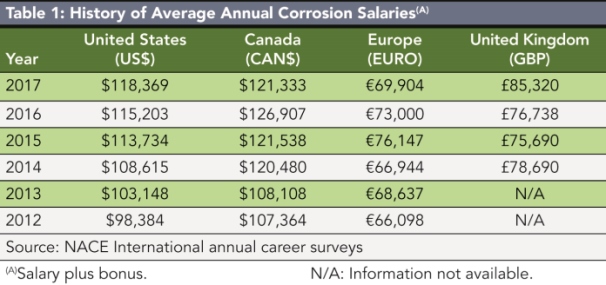
Including salary and bonuses, the average annual U.S. compensation is $118,369, a 2.75% increase over the 2016 average annual salary of $115,203. Last year’s average annual salary increase for the United States was 1.29%.
The Canadian average annual taxable income this year is CAN$121,333, a 4.39% decrease from last year’s average annual salary of CAN$126,907. This compares to a 4.42% increase in the average annual salary experienced by Canadian respondents in 2016.
For the second year in a row, the European average annual salary figure has dropped. The 2017 average annual salary of €69,904 is a decrease of 4.24%. Last year’s average annual salary of €73,000 was down from the previous year’s reported average annual salary by 4.13%.
The average annual salary for survey participants in the United Kingdom is £85,320, up 11.18% from £76,738 reported in 2016, which is a significant increase over the 1.28% rise seen last year. See Table 1 for the history of average annual corrosion salaries.
When converted to U.S. dollars—US$1 equaled CAN$1.3512, €0.8918, and £0.7762 using currency exchange rates at press time (June 1, 2016)1—the average annual salaries can be compared as follows:
• United States: $118,369
• United Kingdom: $109,918
• Canada: $89,795
• Europe: $78,391
The 2017 survey results indicate that the average annual salaries for the United States and United Kingdom are above the U.S. annual mean wage for engineers reported for May 2016 by the U.S. Bureau of Labor and Statistics,2 which is $96,440.
Earnings: 2017 vs. 2016
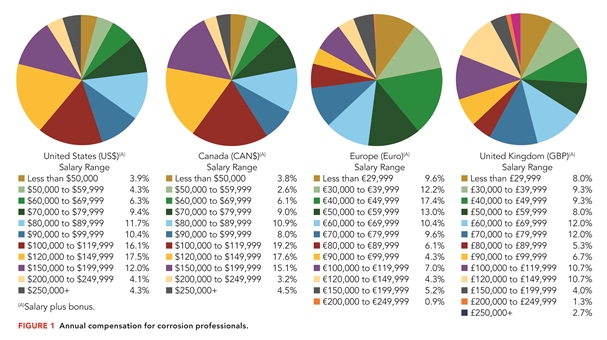
The percentage of U.S. respondents in all annual earnings ranges either increased or remained the same compared to last year. Survey results indicate that 76% earned $80,000 or more (up from 74%); 64% earned $90,000 or more (up from 62%); 54% earned $100,000 or more (up from 52%); 20% earned $150,000 or more (the same), and 8% earned $200,000 or more (the same).
This year’s results for Canadian participants show percentage decreases in all salary ranges when compared to 2016: 79% (down from 81%) earned CAN$80,000 or more annually; 68% (down from 73%) earned CAN$90,000 or more; 60% (down from 62%) earned CAN$100,000 or more; 23% (down from 26%) earned CAN$150,000 or more; and 8% (down from 11%) earned CAN$200,000 or more.
Similarly, survey results for Europe also indicate percentage decreases across all salary ranges. Those who earned an annual salary of €50,000 or more per year decreased to 61% of participants (from 73%); and those who earned €60,000 or more decreased to 48% (from 54%). The percentage of those who earned €70,000 or more decreased to 37% (from 41%); the percentage of those who earned €80,000 or more decreased to 28% (from 29%); those who earned €90,000 or more declined to 22% (from 26%); and those who earned €100,000 or more declined to 17% (from 18%).
The results for U.K. respondents indicate percentage increases in all salary ranges. The number of respondents who earned £50,000 or more increased to 73% from 61% last year; those earning £60,000 or more increased to 65% (compared to 55%); respondents earning £70,000 or more increased to 53% vs. 44%; the number of participants who earned £80,000 or more went up to 41% compared to 34%; those earning £90,000 or more went up to 36% compared to 29%; and the percentage of those who earned over £100,000 went up to 29% compared to 24%. Average annual compensation by salary range is shown in Figure 1.
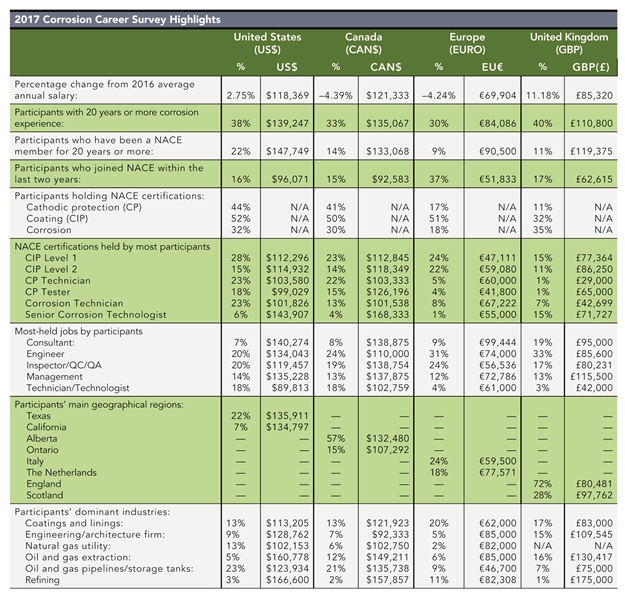
A Closer Look at the Corrosion Control Profession
Highlights of 2017 corrosion career survey are presented below. To all who shared the information that helped create this report for NACE members and others who work in corrosion control, the MP staff extends its appreciation and thanks.
References
1 Exchange-Rates.org, World currency Exchange Rates and Currency Exchange Rate History, http://www.exchange-rates.org/HistoricalRates/E/USD/6-1-2017 (June 7, 2017).
2 U.S. Department of Labor, Bureau of Labor Statistics, “Occupational Employment Statistics, May 2016 National Occupational Employment and Wage Estimates, United States,” http://www.bls.gov/oes/current/oes_nat.htm#17-0000 (June 7, 2017).
Editor’s Note: The complete corrosion career survey article can be viewed at www.nace.org/salarysurvey.aspx.